Climate and Weather Charts
Lima Jorge Chavez International Airport (LIM)
(Lima, Peru)

Lima features a subtropical climate and is located in the southern hemisphere, meaning that summers fall between December and February, with the winter months being June, July and August.
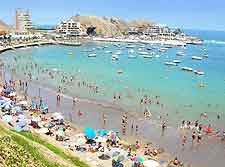
Located on the western coast of Peru, the city of Lima occupies an impressive spot next to the warming Pacific Ocean and has much to offer visitors. The summer climate tends to be hot and dry, with temperatures regularly topping 26°C / 79°F.
Winters too are warm and appealing, averaging around 19°C / 66°F on most days and remaining mild at night. Levels of precipitation in Lima are fairly low and heaviest during the winter months. The average annual daytime temperatures in Lima are around 23°C / 73°F.
Climate Description: Subtropical climate
Lima Callao Jorge Chavez Airport (LIM) Location: Southern Hemisphere, Peru
Annual High / Low Daytime Temperatures at Lima: 27°C / 19°C (81°F / 66°F)
Average Daily January Temperature: 26°C / 79°F
Average Daily June Temperature: 20°C / 68°F
Annual Rainfall / Precipication Lima at Airport (LIM): 199 mm / 8 inches
Lima Callao Jorge Chavez Airport (LIM):
Climate and Weather Charts
Temperature Chart |
| Temperatures |
Jan |
Feb |
Mar |
Apr |
May |
Jun |
Jul |
Aug |
Sep |
Oct |
Nov |
Dec |
Average |
Maximum
Celcius (°C) |
26 |
27 |
26 |
25 |
22 |
20 |
19 |
19 |
20 |
20 |
23 |
24 |
23 |
Minimum
Celcius (°C) |
20 |
20 |
19 |
18 |
17 |
16 |
15 |
15 |
15 |
16 |
16 |
18 |
17 |
Maximum
Fahrenheit (°F) |
79 |
81 |
79 |
77 |
72 |
68 |
66 |
66 |
68 |
68 |
73 |
75 |
73 |
Minimum
Fahrenheit (°F) |
68 |
68 |
66 |
64 |
63 |
61 |
59 |
59 |
59 |
61 |
61 |
64 |
63 |
Rainfall / Precipitation Chart |
| Rainfall |
Jan |
Feb |
Mar |
Apr |
May |
Jun |
Jul |
Aug |
Sep |
Oct |
Nov |
Dec |
Total |
| Rainfall (mm) |
10 |
10 |
8 |
0 |
15 |
23 |
38 |
30 |
30 |
25 |
0 |
10 |
199 |
| Rainfall (inches) |
0.4 |
0.4 |
0.3 |
0.0 |
0.6 |
0.9 |
1.5 |
1.2 |
1.2 |
1.0 |
0.0 |
0.4 |
8 |
| Lima Days of Rain |
3 |
2 |
1 |
1 |
3 |
6 |
8 |
9 |
7 |
4 |
3 |
1 |
48 |
Seasonal Chart |
| Seasons |
Average
Temp
(Max °C) |
Average
Temp
(Min °C) |
Average
Temp
(Max °F) |
Average
Temp
(Min °F) |
Total
Rainfall
(mm) |
Total
Rainfall
(inches) |
| Mar to May (Autumn / Fall) |
24 |
18 |
76 |
64 |
23 |
1 |
| Jun to Aug (Winter) |
19 |
15 |
67 |
60 |
91 |
4 |
| Sept to Nov (Spring) |
21 |
16 |
70 |
60 |
55 |
2 |
| Dec to Feb (Summer) |
26 |
19 |
78 |
67 |
30 |
1 |
 Lima features a subtropical climate and is located in the southern hemisphere, meaning that summers fall between December and February, with the winter months being June, July and August.